

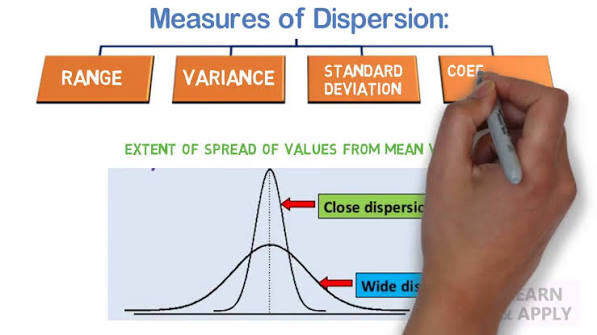
Variation is not noise to be ignored; it is often the real story. Two teams can have the same average performance, two products can have the same average defect rate, and two campaigns can have the same average cost per lead—yet the outcomes can feel completely different day to day. That difference is usually about spread, not centre. Standard deviation is one of the simplest ways to measure that spread, helping you move from “What is typical?” to “How consistent is typical?”
In practice, standard deviation becomes a decision tool: it tells you whether a process is stable enough to scale, whether a forecast is trustworthy, and whether a KPI is improving in a meaningful way or just wobbling around.
1) What Standard Deviation Really Adds Beyond the Average
The average answers one question: “Where is the centre of the data?” Standard deviation answers a second, often more important one: “How widely do values vary around that centre?”
- Low standard deviation means observations cluster tightly around the average—more consistency, less surprise.
- High standard deviation means observations are spread out—more volatility, more risk, more uneven customer experience.
A useful mental model is to treat standard deviation as a “temperature check” for variation. If the average is your destination, standard deviation is the turbulence on the way there. Many operational problems are not caused by a poor average but by excessive variation: the day you miss an SLA, the week inventory runs short, or the month revenue swings unexpectedly.
This is exactly why people who take a Data Analyst Course are trained to look at both centre and spread before drawing conclusions, especially in performance reporting where stability matters as much as improvement.
2) How It’s Calculated and How to Interpret It Without Jargon
At a high level, standard deviation measures the typical distance of values from the mean (average). The computation follows a simple idea:
- Find the mean.
- Compute each value’s deviation from the mean.
- Square those deviations (to avoid negatives cancelling positives).
- Average the squared deviations.
- Take the square root to bring it back to the original units.
A practical detail: you will often see two versions.
- Population standard deviation is used when you truly have all data points for a complete group (rare in real business settings).
- Sample standard deviation is used when your data is a subset and you want to estimate the broader reality (common in analytics).
Interpretation becomes easier when you use context:
- If daily delivery times average 30 minutes with a standard deviation of 2 minutes, most days are close to 30—planning is straightforward.
- If the average is 30 minutes with a standard deviation of 12 minutes, customers will feel the inconsistency even if the average looks fine.
For data that is roughly bell-shaped (often called “normal”), a widely used rule of thumb is:
- About 68% of values fall within ±1 standard deviation of the mean,
- About 95% within ±2,
- About 99.7% within ±3.
This is not magic; it is simply a helpful benchmark when your data resembles that shape. If your data is skewed (common with income, call durations, or website traffic spikes), standard deviation still helps—but you should interpret it alongside other summaries.
3) Real-World Use Cases Where Standard Deviation Changes Decisions
Quality control in manufacturing:
A factory might track the diameter of a component. If the average diameter is on target but standard deviation increases, more units will fall outside tolerance even though the mean remains fine. This is why process improvement focuses on reducing variation, not only shifting the mean.
Customer support handling time:
Imagine two support teams with the same average handling time of 8 minutes. Team A has a standard deviation of 1 minute; Team B has 6 minutes. Team B will produce more “extreme” calls that create queue spikes, agent burnout, and inconsistent customer experience. Reducing variation here can improve SLAs without changing the average much.
Marketing performance volatility:
A campaign could deliver an average cost per acquisition that looks acceptable, but a high standard deviation can signal instability—perhaps performance depends heavily on a few days, a few geographies, or one creative. In that case, budget decisions should be made with dispersion in mind, not average alone.
Finance and risk:
In investment returns, standard deviation is commonly used as a basic measure of volatility. Two assets might have similar average returns, but the one with higher standard deviation demands more risk tolerance. Even outside investing, revenue volatility affects staffing, inventory, and cash-flow planning.
Education and assessment analytics:
If two classes have the same average score, the class with a higher standard deviation likely has unequal learning outcomes—some students are excelling while others are struggling. That insight can guide targeted interventions.
As analytics teams mature—especially in fast-moving markets like Hyderabad—people taking a Data Analytics Course in Hyderabad are increasingly expected to report not just average outcomes but also the uncertainty and variation behind them.
4) Common Mistakes and Better Habits When Using Standard Deviation
- Mistake: Comparing standard deviations across different scales.
A standard deviation of 10 is huge for “minutes” but trivial for “annual revenue in lakhs.” When comparing variability across metrics, consider the coefficient of variation (standard deviation divided by mean), which normalises for scale. - Mistake: Ignoring outliers and skew.
One extreme value can inflate standard deviation. Use it with the median and interquartile range when distributions are heavily skewed. - Mistake: Treating low variation as automatically good.
Low standard deviation can hide a stable but consistently poor outcome. Always read it alongside the mean and business targets. - Better habit: Track standard deviation over time.
A falling average is good; a falling average and shrinking standard deviation is usually better because it signals improvement with reliability.
Analysts who build this discipline—often reinforced in a Data Analyst Course—tend to produce reports that stakeholders trust, because they explain both performance and consistency.
Conclusion
Standard deviation is a practical lens for decision-making because it makes variation measurable. It helps you distinguish between “good on average” and “good reliably,” which is the difference between a KPI that looks fine in a slide deck and a process that works in the real world. When you pair standard deviation with the mean, context, and distribution shape, you gain a clearer view of stability, risk, and where improvements will actually hold up under pressure.
Name:Data Science, Data Analyst and Business Analyst Course in Hyderabad
Address: 8th Floor, Quadrant-2, Cyber Towers, Phase 2, HITEC City, Hyderabad, Telangana 500081
email:[email protected]
Phone number: 095132 58911
